import numpy as np
import matplotlib.pyplot as plt
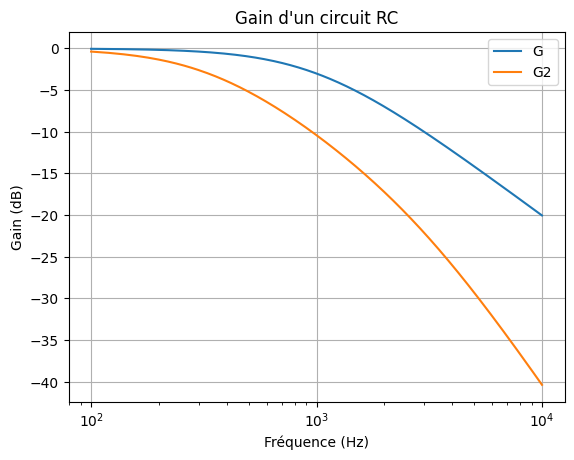
# Gain 1èr ordre
def calculate_gain_first_order(w, R, C):
    return 20 * np.log10(1 / np.sqrt(1 + (w * R * C)**2))

# Gain 2ème ordre
def calculate_gain_second_order(w, R, C):
    return 20 * np.log10( 1 / np.sqrt(1 + (3*R*C*w)**2 + (R**2 * C**2 * w**2)**2 ) )
R = 1000  # ohms
C = 1e-6  # farads

# Calcul de la pulsation w0
w0 = 1 / (R * C)

# Définition du tableau de fréquences
w = np.linspace(0.1 * w0, 10 * w0, 1000)

G = calculate_gain_first_order(w, R, C)
G2 = calculate_gain_second_order(w, R, C)

plt.figure()
plt.plot(w, G, label='G')
plt.plot(w, G2, label='G2')
plt.xscale('log')
plt.xlabel('Fréquence (Hz)')
plt.ylabel('Gain (dB)')
plt.title('Gain d\'un circuit RC')
plt.grid(True)
plt.legend()
plt.show()